Win rate and expectancy
Total trades, winning percentage, average win-to-loss ratio, and expected value per trade — broken down by session (Asian, London, New York) so you can see where your edge actually sits and where it disappears.

Service
Practice Partners' backtesting engine runs your logic against tick-level historical data and delivers a report you can actually act on.
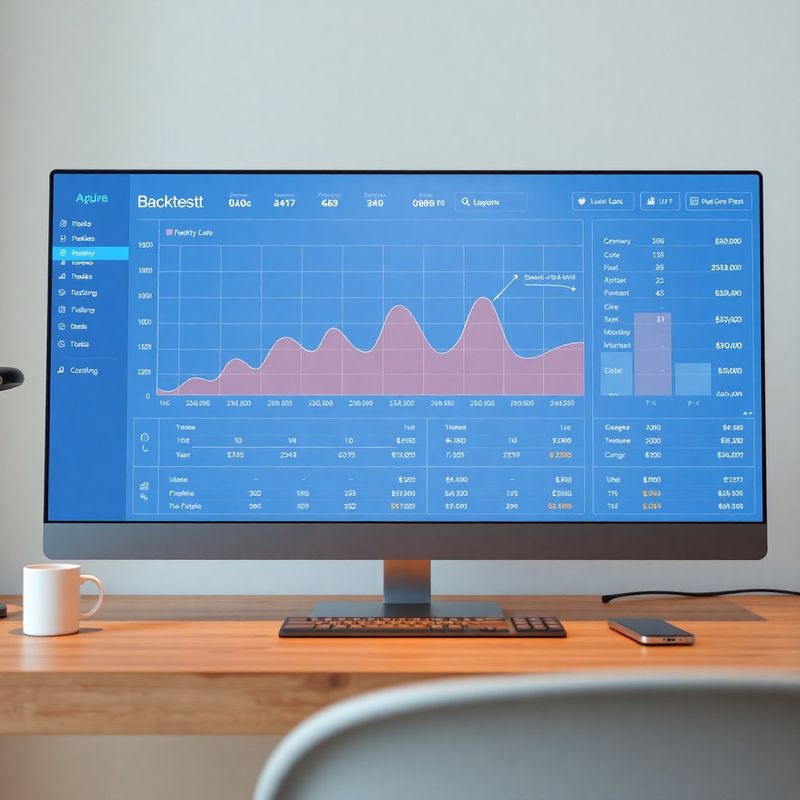
Bar-close backtests are fast but misleading. If your strategy reacts to intra-bar price movements — breakouts, stop hunts, news spikes — bar-close simulation misses the sequence of events entirely and overstates performance. Practice Partners uses tick-level data sourced from three independent liquidity providers, giving you the most accurate fill simulation available for retail and semi-institutional strategies. The difference between a 60% win rate on bar data and a 51% win rate on tick data is exactly the kind of discovery that prevents costly live deployment of a broken strategy.
Every metric is documented with its calculation method so you know what you're reading.
Total trades, winning percentage, average win-to-loss ratio, and expected value per trade — broken down by session (Asian, London, New York) so you can see where your edge actually sits and where it disappears.
Peak-to-trough drawdown in both percentage and absolute terms, with a sequence chart showing the worst consecutive loss run in the test period. This is the number risk managers look at first, and now you'll have it too.
Fills are simulated using real spread data from your target broker's historical quotes, with configurable commission per lot. The net P&L figure in your report already accounts for these costs — no hidden optimism.
Every backtest produces a structured, printable PDF — 12 pages covering all metrics, equity curve, trade log, and parameter summary. Delivered to your dashboard within 20 minutes of job completion.
I had tested my gold breakout strategy on weekly bars for months and thought it was solid. The Practice Partners tick-level backtest showed that 30% of my supposed winning trades filled at prices I never would have got in real life. It was not pleasant reading, but it saved me from deploying capital on a strategy with a fundamental data illusion. I spent two more weeks refining the entry filter and the adjusted backtest looked much more honest.
Ruxandra T., systematic trader, Timișoara
Submit your strategy parameters and receive a full tick-level report within the hour.
Start your backtest